How to Self-Host Uptime Kuma With Docker for Free Website Monitoring
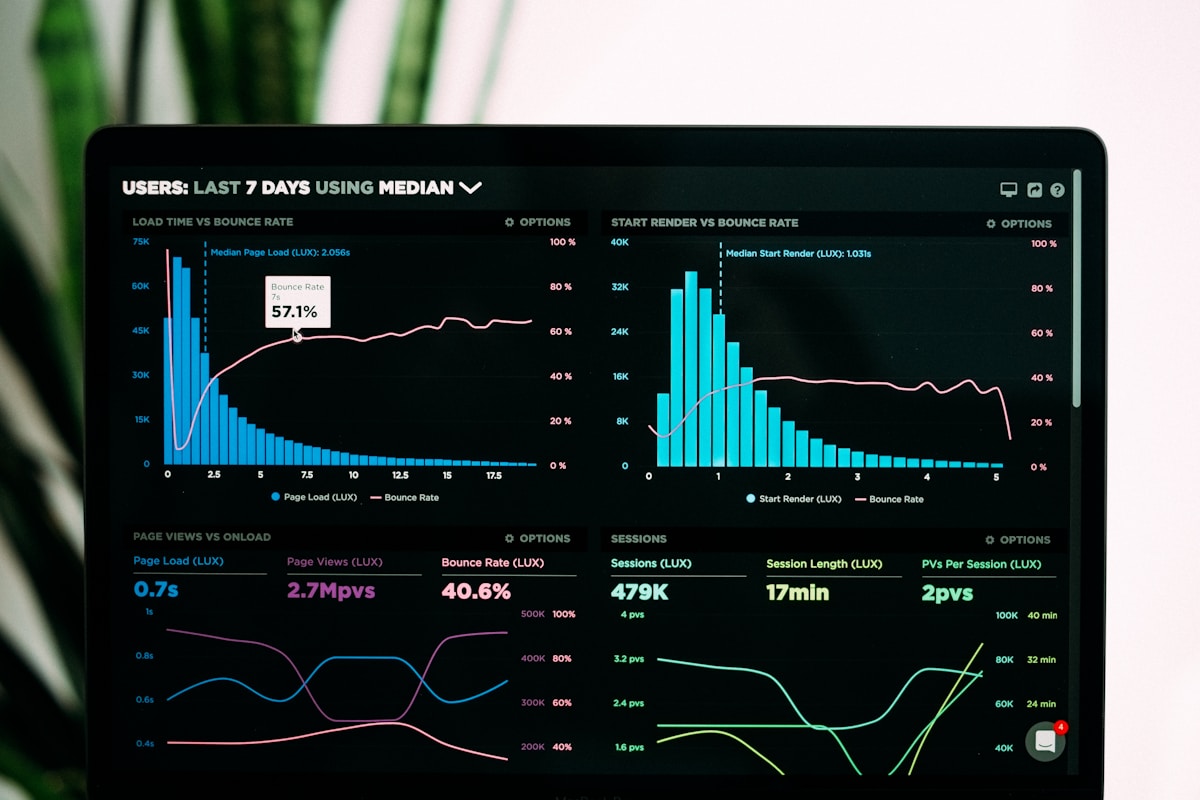
- Primary Signal: How to Self-Host Uptime Kuma With Docker for Free Website Monitoring
- Overview: Uptime Kuma is a free, open-source monitor you run yourself with one Docker command. It checks your sites every minute, alerts you through Telegram, Discord, or email, and costs no...
- Verification: Analyzed and compiled by FreeSky Cloud editorial monitoring desk.
Every website owner has learned about an outage from a visitor instead of from their own monitoring, and that embarrassment is exactly what uptime monitoring prevents. Uptime Kuma is a free, open-source tool that checks your websites, APIs, and services on a schedule you set, and alerts you the moment something fails. Because you host it yourself, there is no subscription, no monitor limit, and no monthly fee beyond the small server it runs on.
Installation takes about five minutes if you already have Docker. A single command starts the container with a persistent data volume, mapping its web interface to a port on your server. On first launch you open the interface in a browser, create an admin account, and you are ready to add monitors. There is no external database to configure and no complex setup, which is why Uptime Kuma is often recommended as a first self-hosted project.
Adding a monitor is equally simple. Choose HTTP for a website or API, enter the URL, and set the check interval, with 60 seconds being a sensible default for most small sites. You can add keyword checks that alert you if a page loads but shows the wrong content, TCP checks for non-web services, DNS checks for domain records, and Docker container checks if you monitor containers on the same host. Each monitor gets its own status history and uptime percentage on the dashboard.
Notifications are where Uptime Kuma earns its keep. It supports dozens of channels, including Telegram, Discord, Slack, email, and push services, and you can assign different channels to different monitors. A practical setup sends routine alerts to a chat channel you already watch, and critical alerts to a channel that will wake you up, such as a push notification. Test the notification channel after configuring it, because an alert system you have never tested is a system you cannot trust.
Status pages are a bonus feature that small teams often overlook. Uptime Kuma can publish a public status page showing your services and their recent uptime, which is useful for client-facing projects and for your own accountability. A status page with a clean history also reassures visitors during an incident, since they can see that you know about the problem and are working on it, rather than wondering whether anyone noticed.
One structural rule matters more than any feature: never run your only monitor on the same server it watches. If that machine fails, the monitor fails with it, and you hear nothing at all. Host Uptime Kuma on a separate small server, a cheap VPS in a different region, or even a small home device, so that an outage of your main site does not also silence your alerting. This separation is the difference between monitoring and a false sense of security.
Secure the installation before you expose it. Put the web interface behind a reverse proxy with HTTPS, keep it off the public internet if only you need it, and enable two-factor login, which Uptime Kuma supports. With those precautions, a free self-hosted monitor gives you professional-grade visibility into your sites, and the first time it alerts you to an outage before a visitor does, it will have paid for itself many times over.
Beyond basic uptime checks, Uptime Kuma supports maintenance windows and grouped monitors that make it useful for small teams managing several client sites. Group monitors by client or project, so a single dashboard view shows the health of everything you look after, and set maintenance windows before planned work so scheduled downtime does not trigger false alerts. You can also use push monitors, where your own scripts report in on a heartbeat schedule, which is ideal for background jobs and cron tasks that produce no web endpoint to check. A backup script that pings Uptime Kuma on success, for example, turns silent backup failures into visible alerts, since a missed heartbeat is itself the warning. These features take minutes to configure and turn a simple uptime checker into a lightweight operations dashboard.
📖 Continue Reading the Full Story
Continue reading this article on FreeSky Cloud.
⚡ Access Full Content NowMore from FreeSky Cloud


 🤖 WinBar AI
YouTube to MP3 Converter: Extract Audio Free
Convert YouTube videos to MP3 audio free. High-quality 320kbps extraction, no software install needed....
 ⚡ CyberTech 568
Internet Latency Test: How Fast Is Your Connection?
Test your internet latency free. Get accurate ping measurements and learn what your numbers mean for gaming an...
 🛰️ FreeSky Aerial
Troubleshooting Guide: Freelancer Net Pay Calculator (PKR) — Upwork, Fiverr & Payoneer Fees (Day 12 Guide)
Diagnosing hidden issues using the Freelancer Net Pay Calculator (PKR) — Upwork, Fiverr & Payoneer Fees on Fre...
🔭 FreeSky Cosmos
Pro Tips & Tricks: Freelancer Net Pay Calculator (PKR) — Upwork, Fiverr & Payoneer Fees (Day 13 Guide)
How professionals get 10x value from the Freelancer Net Pay Calculator (PKR) — Upwork, Fiverr & Payoneer Fees ...