Free Monitoring Tools for Developers: Uptime, Logs and Alerts for $0
- Primary Signal: Free Monitoring Tools for Developers: Uptime, Logs and Alerts for $0
- Overview: Free monitoring tools for developers: uptime checks, log aggregation and alerts that cost nothing....
- Verification: Analyzed and compiled by FreeSky Cloud editorial monitoring desk.
Your application will fail at 3am, and the difference between a five-minute outage and a five-hour one is whether something noticed. Free monitoring tools watch your uptime, collect your logs, and alert you when things break, all for $0. This guide covers the free tools that cover the three jobs every developer needs: uptime, logs and alerts.
Uptime Monitoring: UptimeRobot and Friends
UptimeRobot's free plan checks up to 50 monitors every five minutes and alerts you by email, which is enough for most personal projects and small applications. Better Uptime and Freshping offer similar free tiers with nicer status pages. Set up a monitor for every public endpoint, not just the homepage, because an API can fail while the homepage stays up. A status page that shows your history builds trust with users.
Logs: Grafana Cloud and the Free Tier
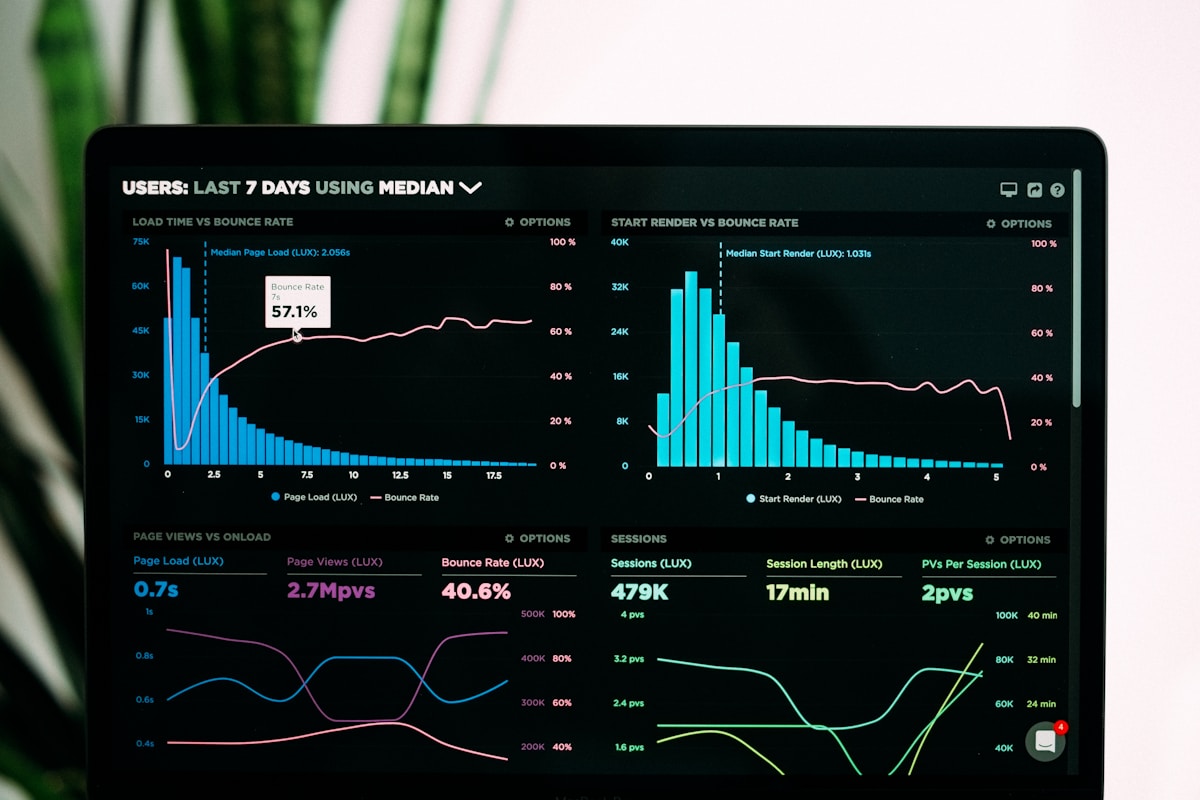
Grafana Cloud's free tier includes 50GB of logs a month, which is generous for a small application, plus metrics and traces. It gives you a single place to search logs, build dashboards, and spot patterns before they become outages. The alternative is to ship logs to a cheap VPS and search them with grep, which works but scales poorly. Start with Grafana Cloud's free tier and move to self-hosted when the volume grows.
Alerts: Getting Woken Up Properly
An alert that arrives by email is easy to miss at 3am, so connect your monitoring to a channel you actually watch: Slack, Telegram, or a push notification service. PagerDuty and Opsgenie have free tiers for small teams that handle alert routing and escalation. Set alert thresholds carefully: too sensitive and you ignore them, too lax and you miss real outages. Alert on symptoms users feel, such as errors and slowness, not on internal metrics alone.
The Three-Layer Setup
The practical setup is three layers: uptime checks for availability, log aggregation for diagnosis, and alerts for notification. Each layer is free at small scale, and together they give you the same coverage a paid service offers. Document the setup in your project README so a teammate can understand it, and test the alert path monthly by triggering a fake outage. Monitoring you never test is monitoring you cannot trust.
When to Pay for Monitoring
Pay when your free tier runs out, when you need more than five-minute check intervals, or when you need features like synthetic monitoring and SLA reporting. The cost is usually modest, and the alternative, an outage you discover from angry users, is far more expensive. Treat monitoring as infrastructure, not as an optional extra: the first outage you catch in five minutes pays for a year of the service.
Monitoring as a Habit
Monitoring only works if someone looks at it: an alert that nobody reads is the same as no alert. Build a habit of checking your dashboard every morning, and review your alerts monthly to remove the noisy ones. The goal is a monitoring setup that you trust, so when it is quiet, you know the system is healthy, and when it alerts, you act. A dashboard you ignore is a decoration, and an alert you dismiss is a warning you have chosen to miss.
Key Takeaways
- UptimeRobot's free plan checks 50 monitors every five minutes - Grafana Cloud's free tier includes 50GB of logs a month - Alert on symptoms users feel, not internal metrics alone - Test your alert path monthly with a fake outage
Frequently Asked Questions
What is the best free uptime monitoring tool? UptimeRobot, for its generous free plan covering 50 monitors. Grafana Cloud covers logs and metrics free up to 50GB a month.
Monitoring is the difference between a five-minute outage and a five-hour one. Set up the three layers free, test them monthly, and sleep better.
More from FreeSky Cloud